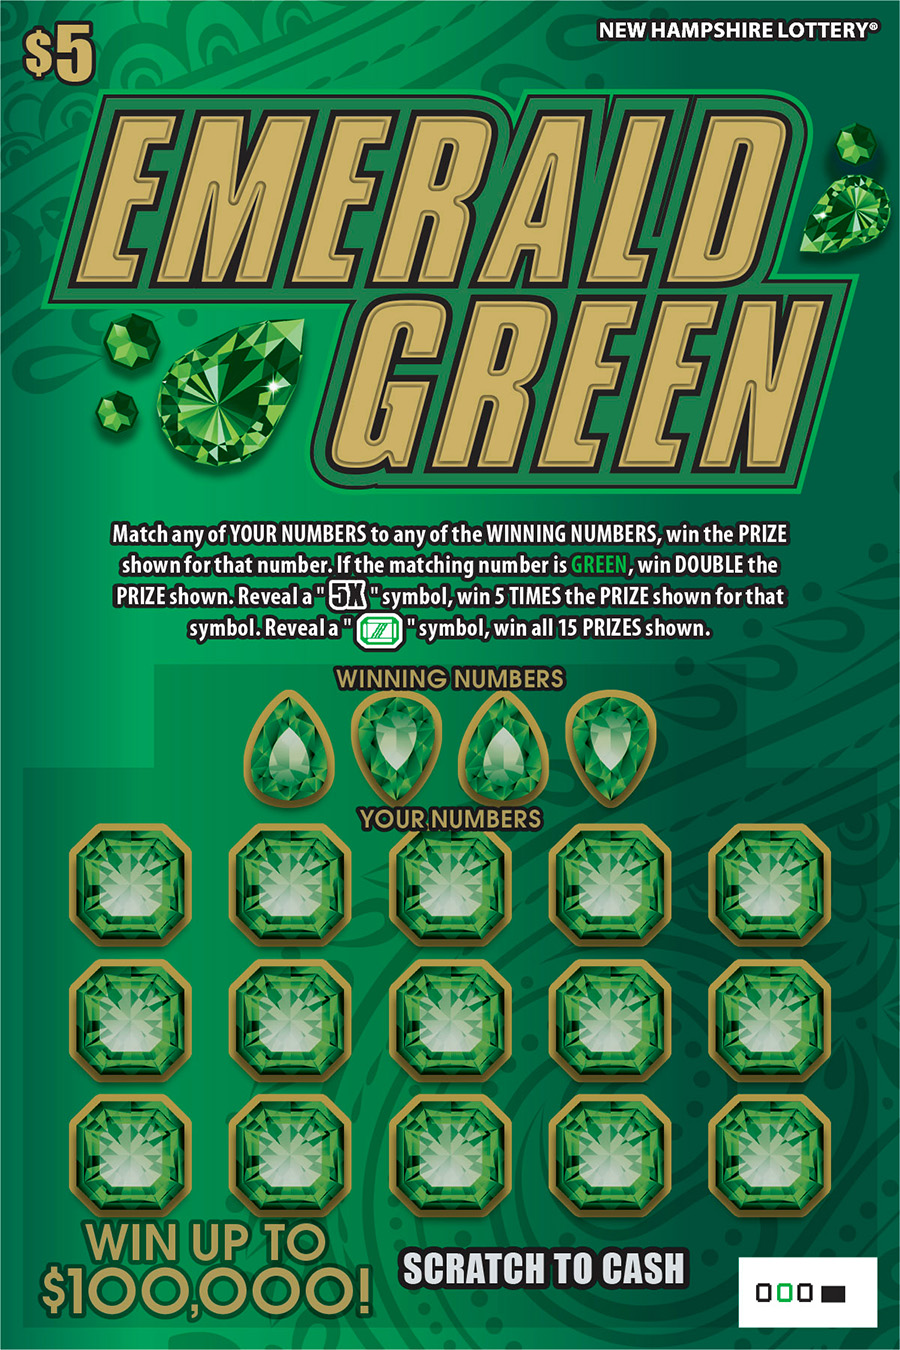
Emerald Green

Image Credit: New Hampshire State Lottery
Ticket Price: $5
Starting Odds: 1 in 4.09
Current Odds to Win $100 or More: 1 in 326.48
Current Odds to Win $1,000 or More: 1 in 55,174.58
Current Odds to Win $10,000 or More: 1 in 331,047.49
Estimated Tickets Remaining: 331,047.49 (25.4%)
Total $100,000 Prizes Remaining: 1 out of 4
Total $5,000 Prizes Remaining: 2 out of 12
Total $1,000 Prizes Remaining: 3 out of 16
About "Emerald Green" Scratch Ticket in New Hampshire
The "Emerald Green" scratch ticket is one of the lottery options available in New Hampshire. The price of a ticket is $5.
When this game was first released, the starting odds of winning were 1 in 4.09.
The odds of winning at least $100 in Emerald Green are 1 in 326.48.
The chances of securing $1,000 or more are 1 in 55,174.58.
For those dreaming of hitting a jackpot, the odds of winning $10,000 or more are 1 in 331,047.49.
As of the last update on 10/05/2025 at 08:53AM EDT, approximately 25.4% of tickets are still in circulation. This means there are still unclaimed prizes waiting to be won in New Hampshire's Emerald Green scratch ticket.
Prize Chart for "Emerald Green"
| Prize | Total Prizes | Prizes Remaining | Starting Odds | Current Odds | Change in Odds |
|---|---|---|---|---|---|
| $5 | 143,400 | 37,561 | 1 in 9.09 | 1 in 8.81 | 3.03% |
| $10 | 117,243 | 29,911 | 1 in 11.12 | 1 in 11.07 | 0.44% |
| $20 | 26,093 | 6,356 | 1 in 49.95 | 1 in 52.08 | — |
| $25 | 14,869 | 3,377 | 1 in 87.66 | 1 in 98.03 | — |
| $50 | 12,512 | 2,867 | 1 in 104.17 | 1 in 115.47 | — |
| $100 | 4,266 | 924 | 1 in 305.53 | 1 in 358.28 | — |
| $250 | 410 | 84 | 1 in 3,179.02 | 1 in 3,941.04 | — |
| $1,000 | 16 | 3 | 1 in 81,462.5 | 1 in 110,349.16 | — |
| $5,000 | 12 | 2 | 1 in 108,616.67 | 1 in 165,523.74 | — |
| $100,000 | 4 | 1 | 1 in 325,850 | 1 in 331,047.49 | — |
Frequently Asked Questions
What is the scratch ticket price of "Emerald Green"?
Each ticket costs $5, giving you a chance to win prizes ranging from small amounts to the top jackpot.
What is the jackpot or highest prize you can win playing "Emerald Green"?
The grand prize you can win playing "Emerald Green" is $100,000.
What is the smallest prize you can win playing "Emerald Green"?
The smallest prize for "Emerald Green" is $5.
What were the original odds of winning any prize?
The starting odds of winning any prize are approximately 1 in 1 in 4.09.
How are the odds calculated for New Hampshire scratch tickets?
The odds and statistics for New Hampshire's scratch tickets are based on official lottery data processed through statistical models. This is to help players understand their chances of winning in New Hampshire's scratch tickets.
- Starting Odds: These are the official odds provided by the New Hampshire lottery at the scratch ticket's launch. They indicate the probability of winning any prize when all tickets are still in circulation.
- Estimated % Tickets Remaining: If not provided by the state, this is estimated based on the number of claimed prizes relative to the game's original prize structure. For example, if a game started with 1 million scratch tickets and half of the top prizes have been claimed, it is estimated that about 50% of the scratch tickets have been sold.
- Current Odds to Win $100/$1,000/$10,000 or More: These odds indicate the likelihood of winning higher-tier prizes in New Hampshire scratch tickets. They are determined by summing the probabilities of all applicable prize amounts using the current odds.
- Current Odds to Win the Grand Prize: This metric shows the probability of winning the game's largest prize, adjusted for the estimated remaining tickets and current odds.
- Expected Value (EV): EV represents the average return of a single scratch ticket based on the current prizes remaining. It is calculated by multiplying each prize amount by its probability of winning (prizes remaining ÷ estimated tickets remaining), summing these values, and subtracting the ticket price. A positive EV indicates an expected profit per ticket, while a negative EV indicates an expected loss.
Where does Scratch-Off Hub get information on New Hampshire lottery scratch tickets, odds, prizes remaining, and tickets remaining?
Games, prizes, and odds for New Hampshire scratch tickets are sourced directly from The Official New Hampshire Lottery Website.
Related $5 New Hampshire Scratch Tickets Sorted by Best Odds:
Looking for more New Hampshire scratch tickets?
See Which New Hampshire Scratch Tickets Still Have Prizes Remaining